Analytics & BI Enablement

Turn trusted data into decisions people can act on.

OT Solutions builds reporting your teams actually use — clear dashboards and metrics that mean the same thing everywhere — so every decision starts from the same trusted numbers.

Since 2000·Canadian consulting·Senior-led delivery
25+ years

delivering data solutions that last

Senior-led delivery

experienced consultants, practical outcomes

Power BI & enterprise BI

platform-agnostic, outcome-focused

From assessment to adoption

end-to-end enablement that sticks

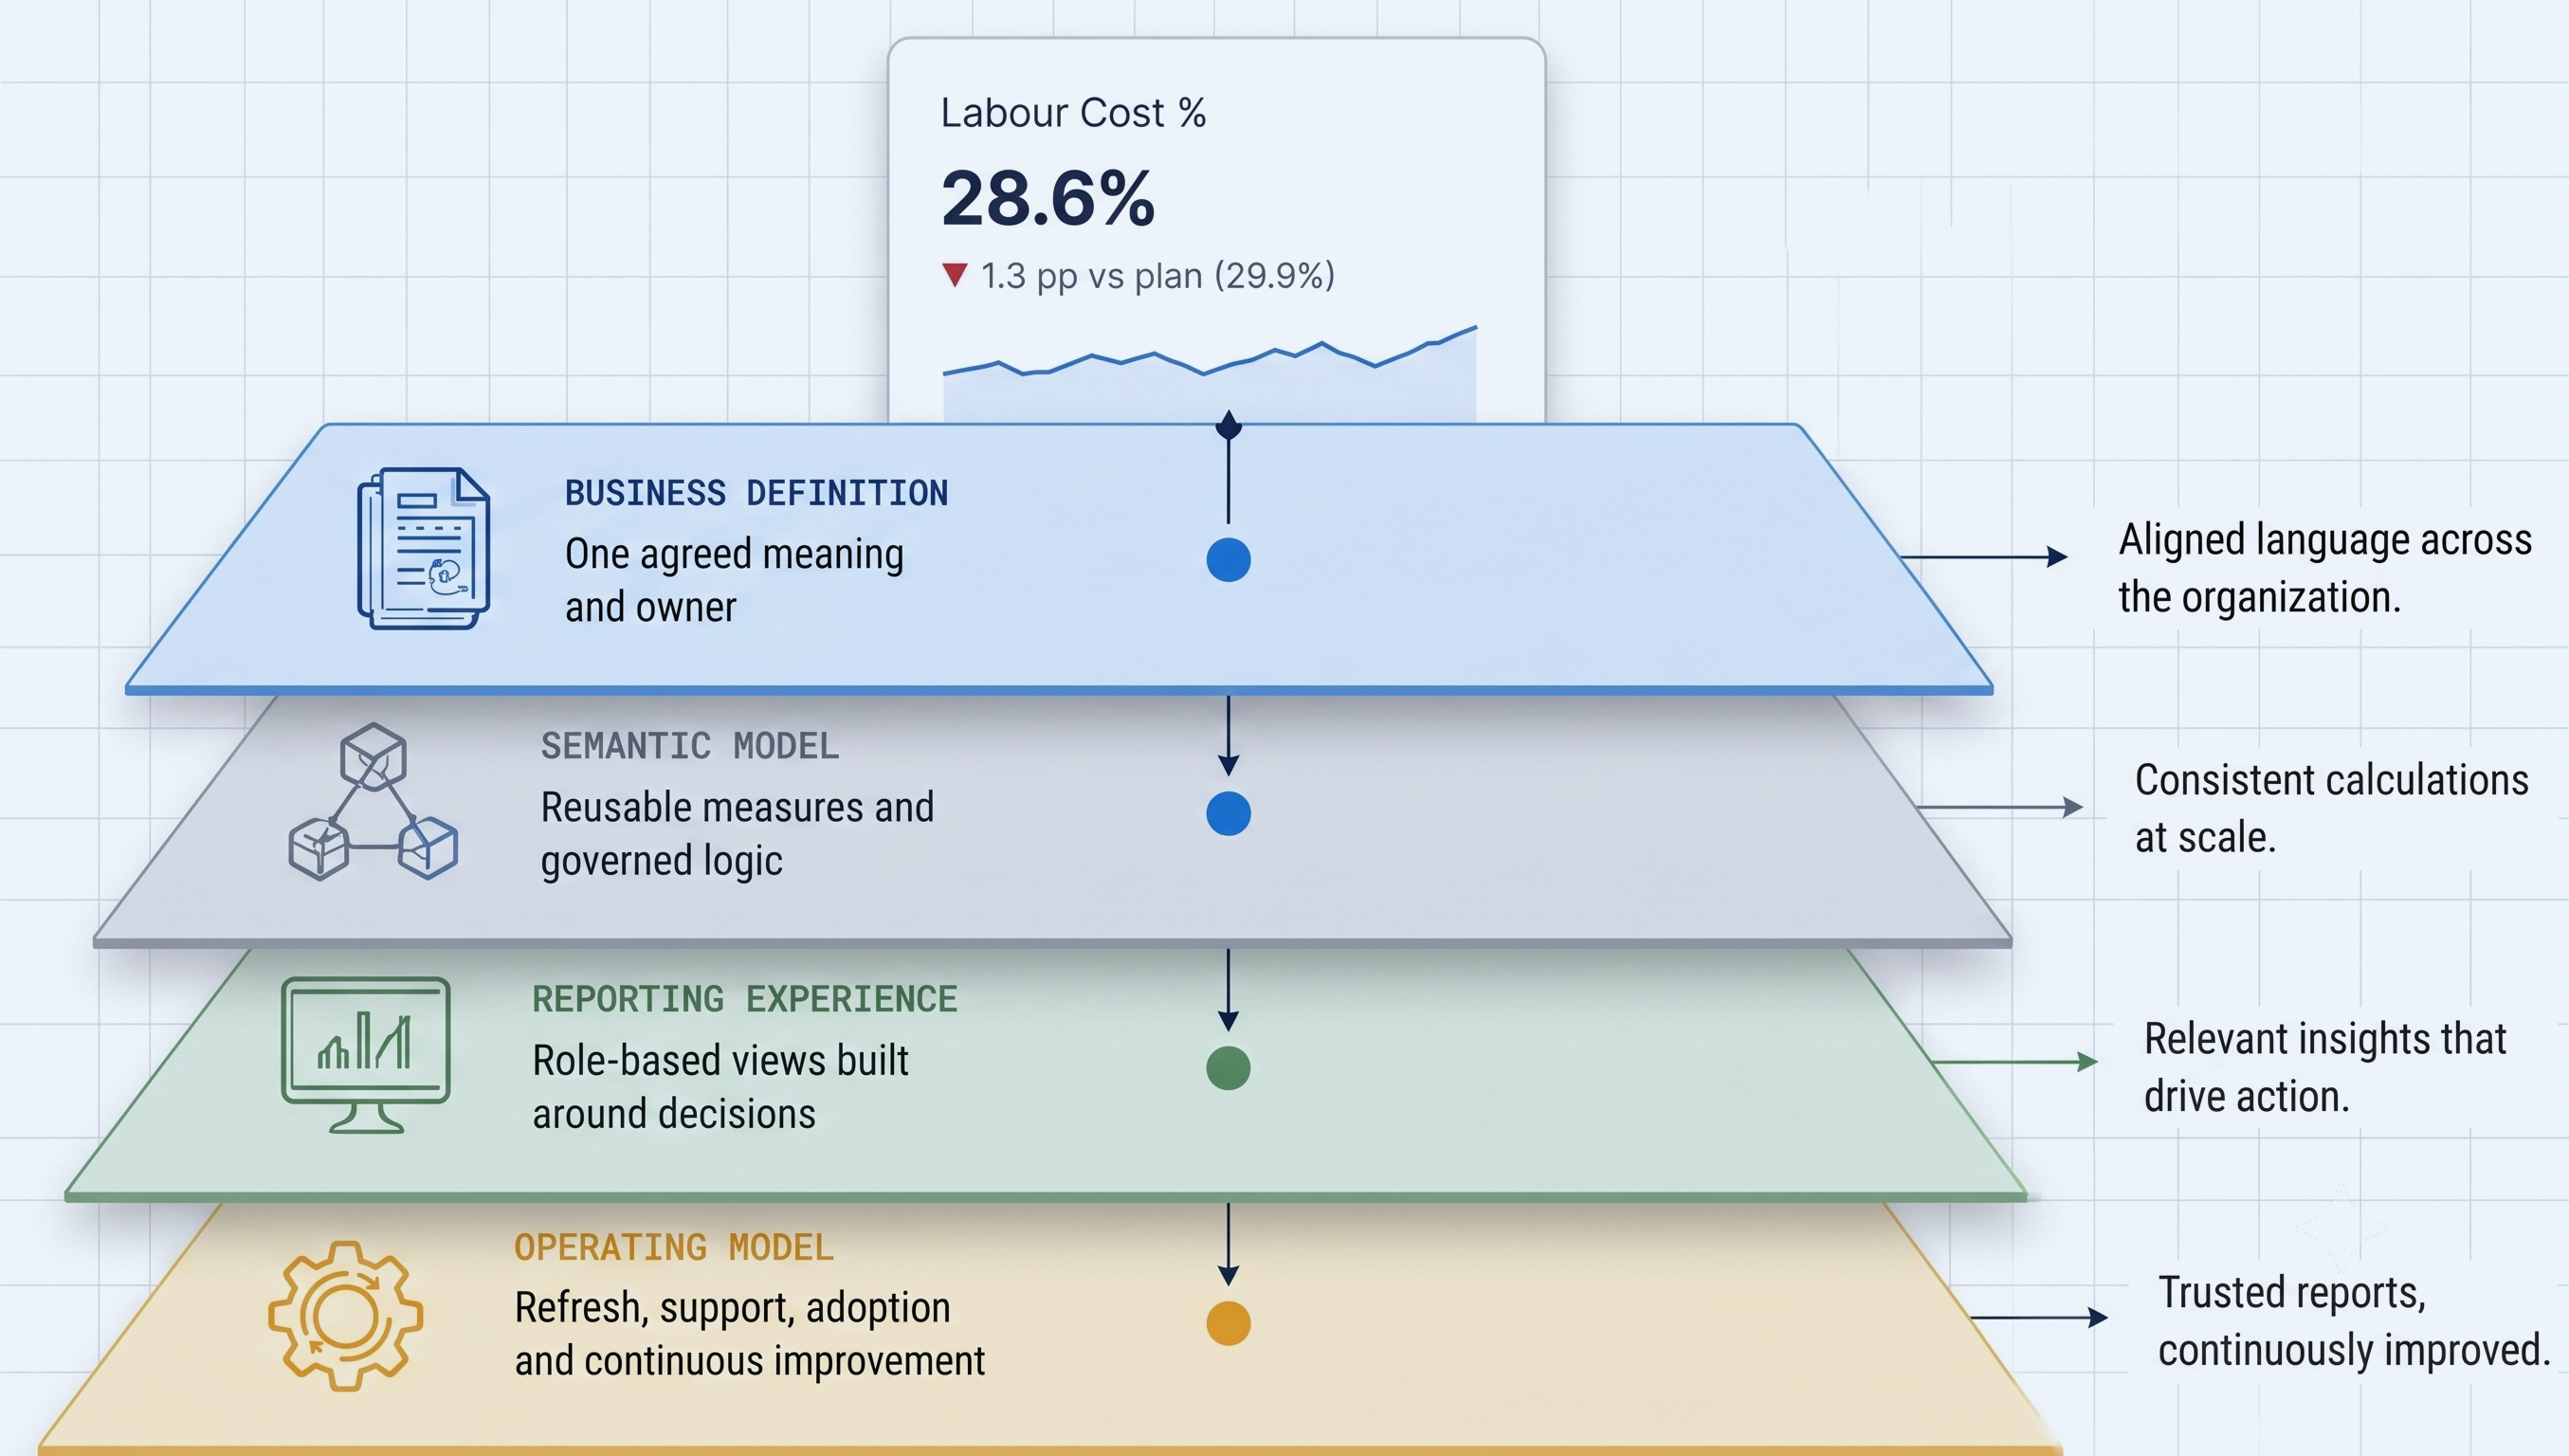
A trusted report has more underneath than a chart.

We build the four foundations that turn numbers into decisions.

A Labour Cost % KPI card resting on four stacked layers — business definition, semantic model, reporting experience and operating model — producing aligned language, consistent calculations, relevant insights and trusted reports.

What we enable.

01

Executive Dashboards & KPIs

Clear, decision-ready views that focus on what matters most.

  • KPI design
  • Executive scorecards
  • Variance & trend analysis
OutcomeConfident decisions backed by trusted performance.
02

One Trusted Set of Metrics

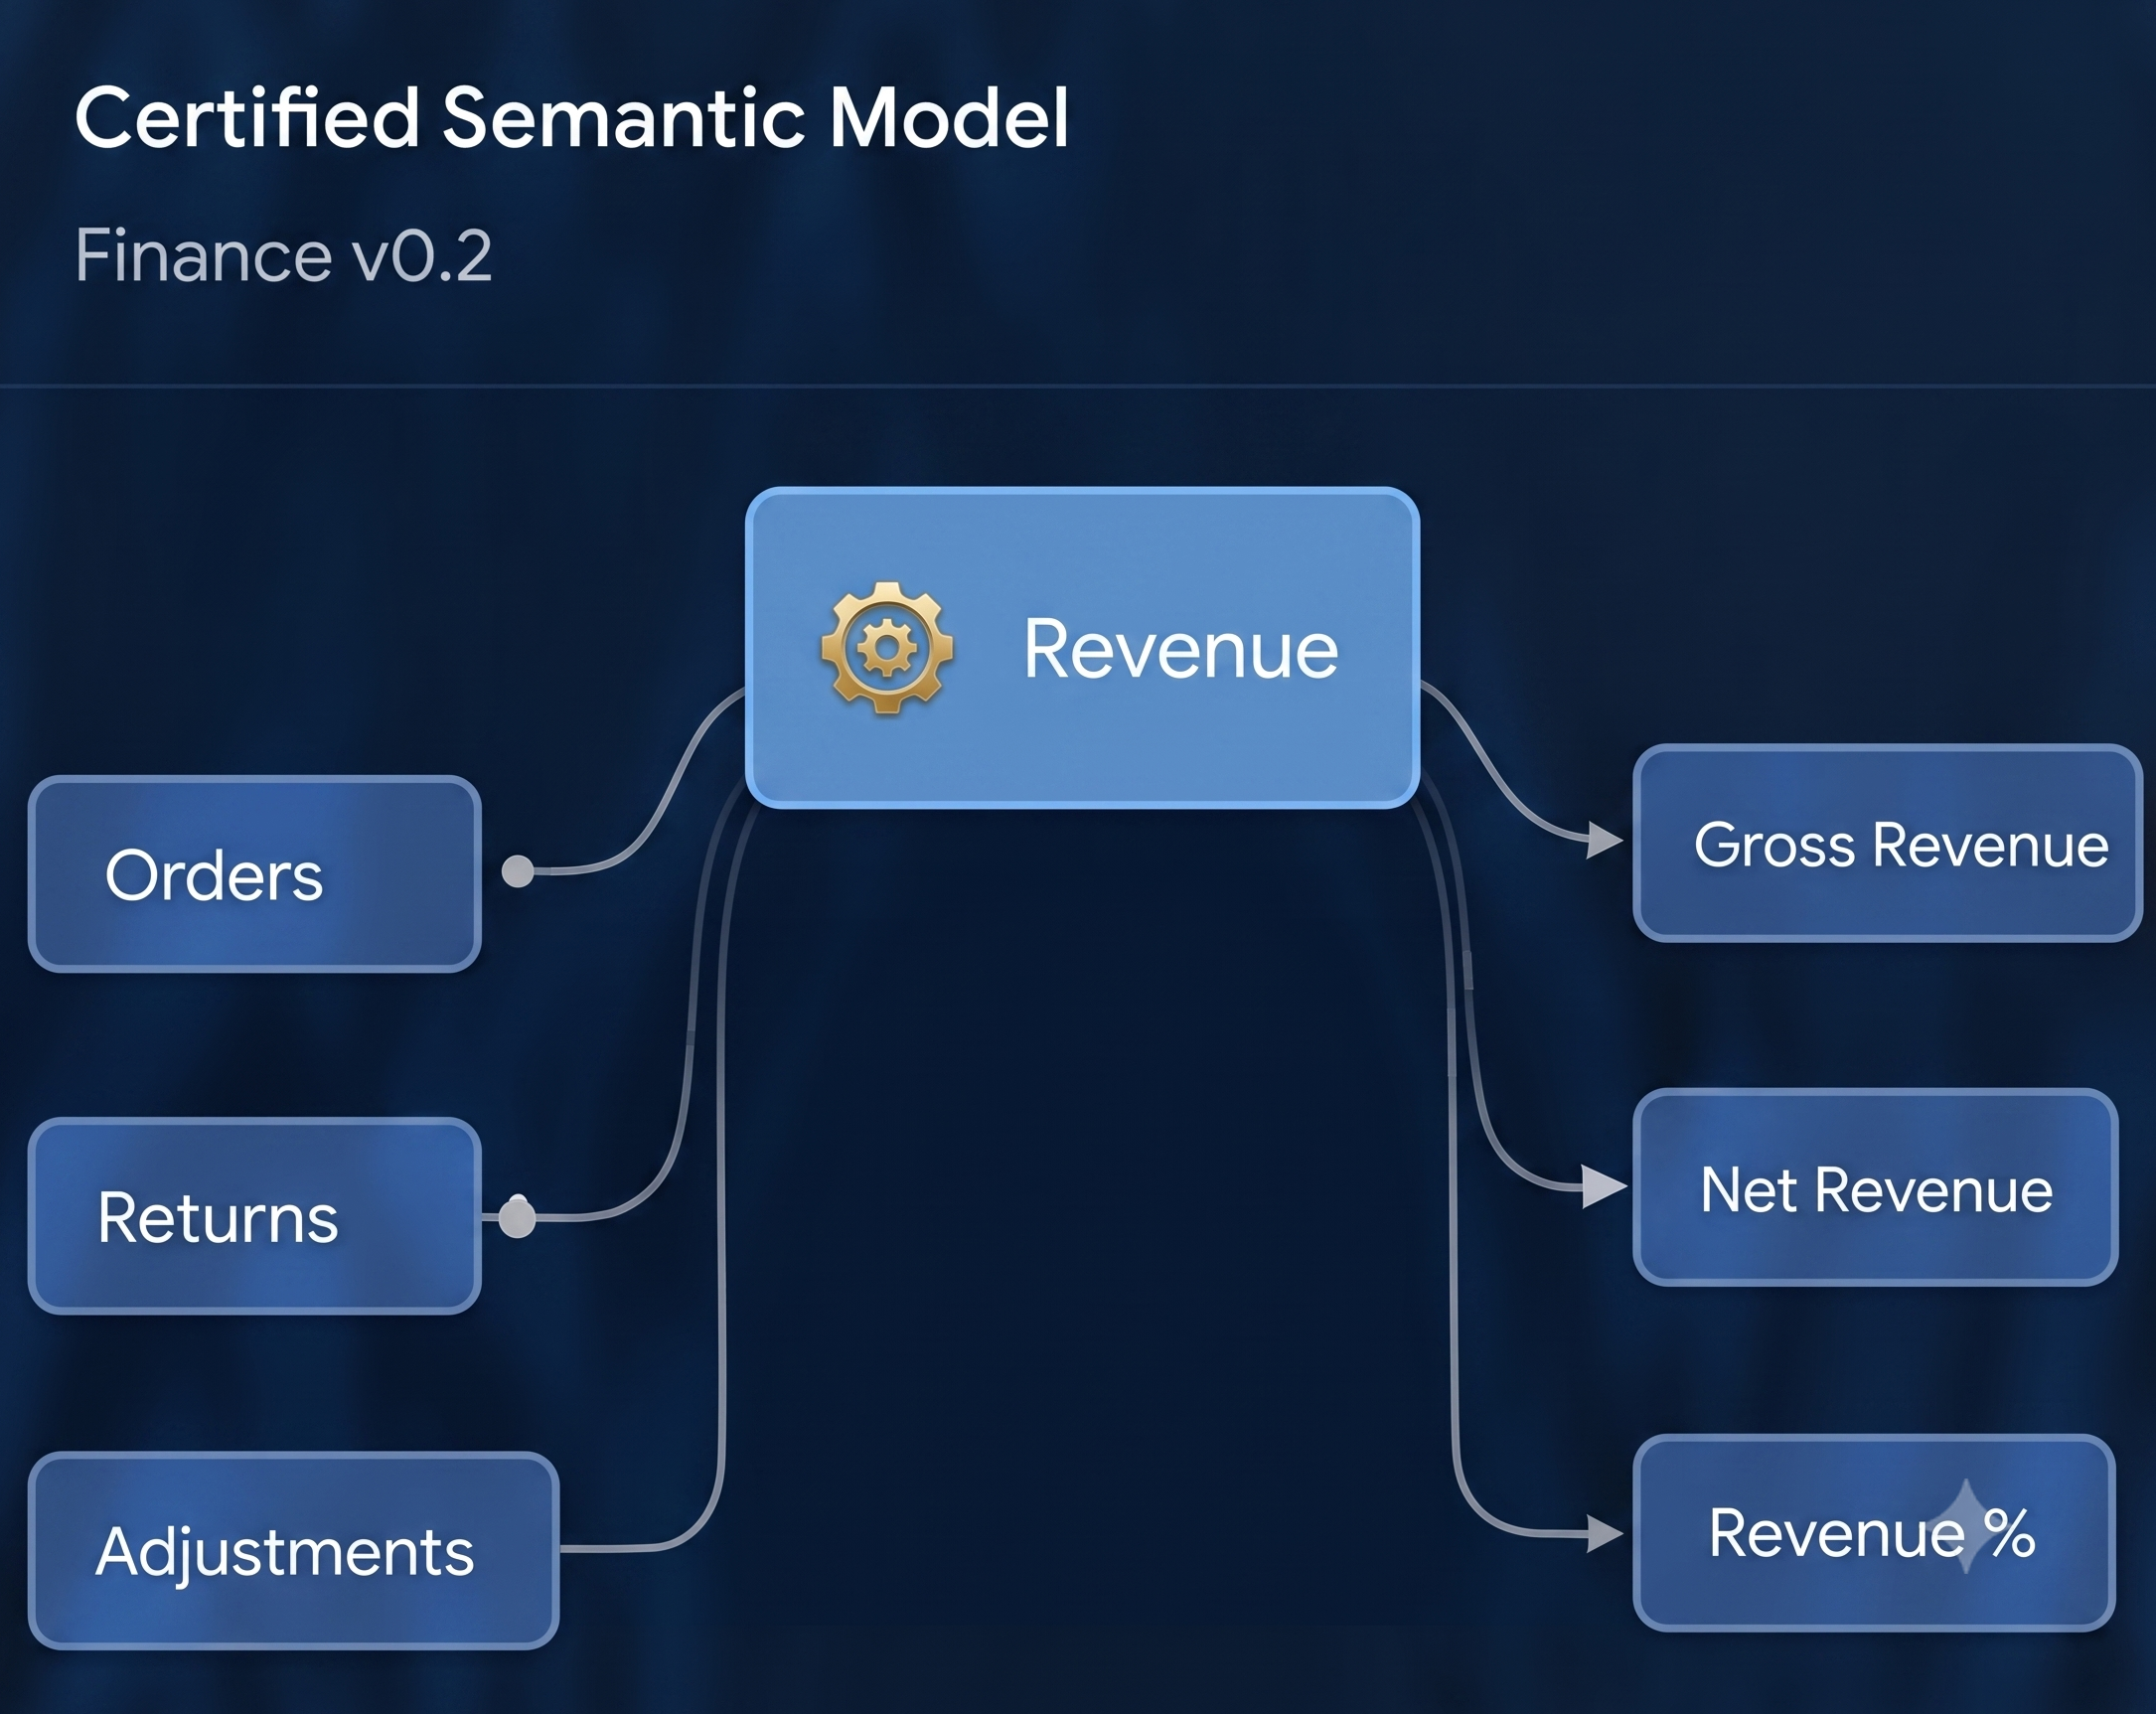
One shared definition for every metric — so your reports stop disagreeing.

  • Agreed metric definitions
  • One shared data model
  • Consistent calculations
OutcomeOne version of the truth across every report.
03

Safe Self-Serve Reporting

Let teams answer their own questions — using numbers that are already approved.

  • Approved datasets
  • Role-based access
  • Built-in review
OutcomeFaster answers without compromising trust.
04

Fewer, Better Reports

Right reports, right audience, right cost.

  • Report inventory
  • Cutting redundant reports
  • A clear plan forward
OutcomeLower cost, higher impact from your reporting.

When every report tells a different story.

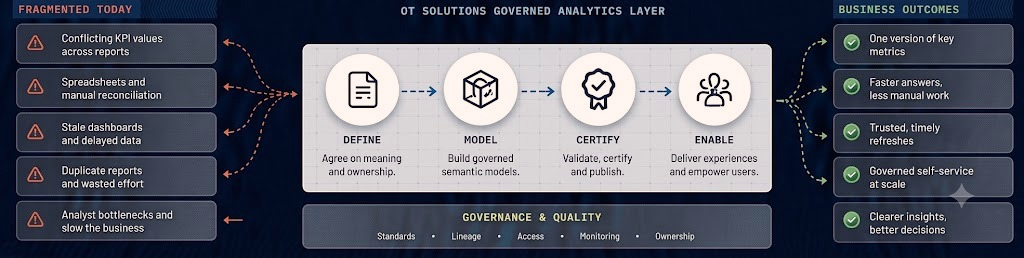
Fragmented today — conflicting KPI values, manual reconciliation, stale dashboards, duplicate reports and analyst bottlenecks — flows through the OT Solutions governed analytics layer (define, model, certify, enable, over governance and quality) into business outcomes: one version of key metrics, faster answers, trusted refreshes, governed self-service at scale and clearer decisions.

Built for adoption, not just launch.

01Align

Understand decisions, metrics and data.

Deliverables
  • Metric dictionary
  • Decision map
  • Data & report inventory
02Build

Design and build trusted models and reports.

Deliverables
  • Shared data model
  • Priority dashboards
  • Security & access model
03Validate

Validate results and build confidence.

Deliverables
  • Business validation
  • Signed-off numbers
  • Certified metrics
04Embed

Enable users and sustain value.

Deliverables
  • Training & enablement
  • Ownership model
  • Support & monitoring

The same truth, shaped for every decision.

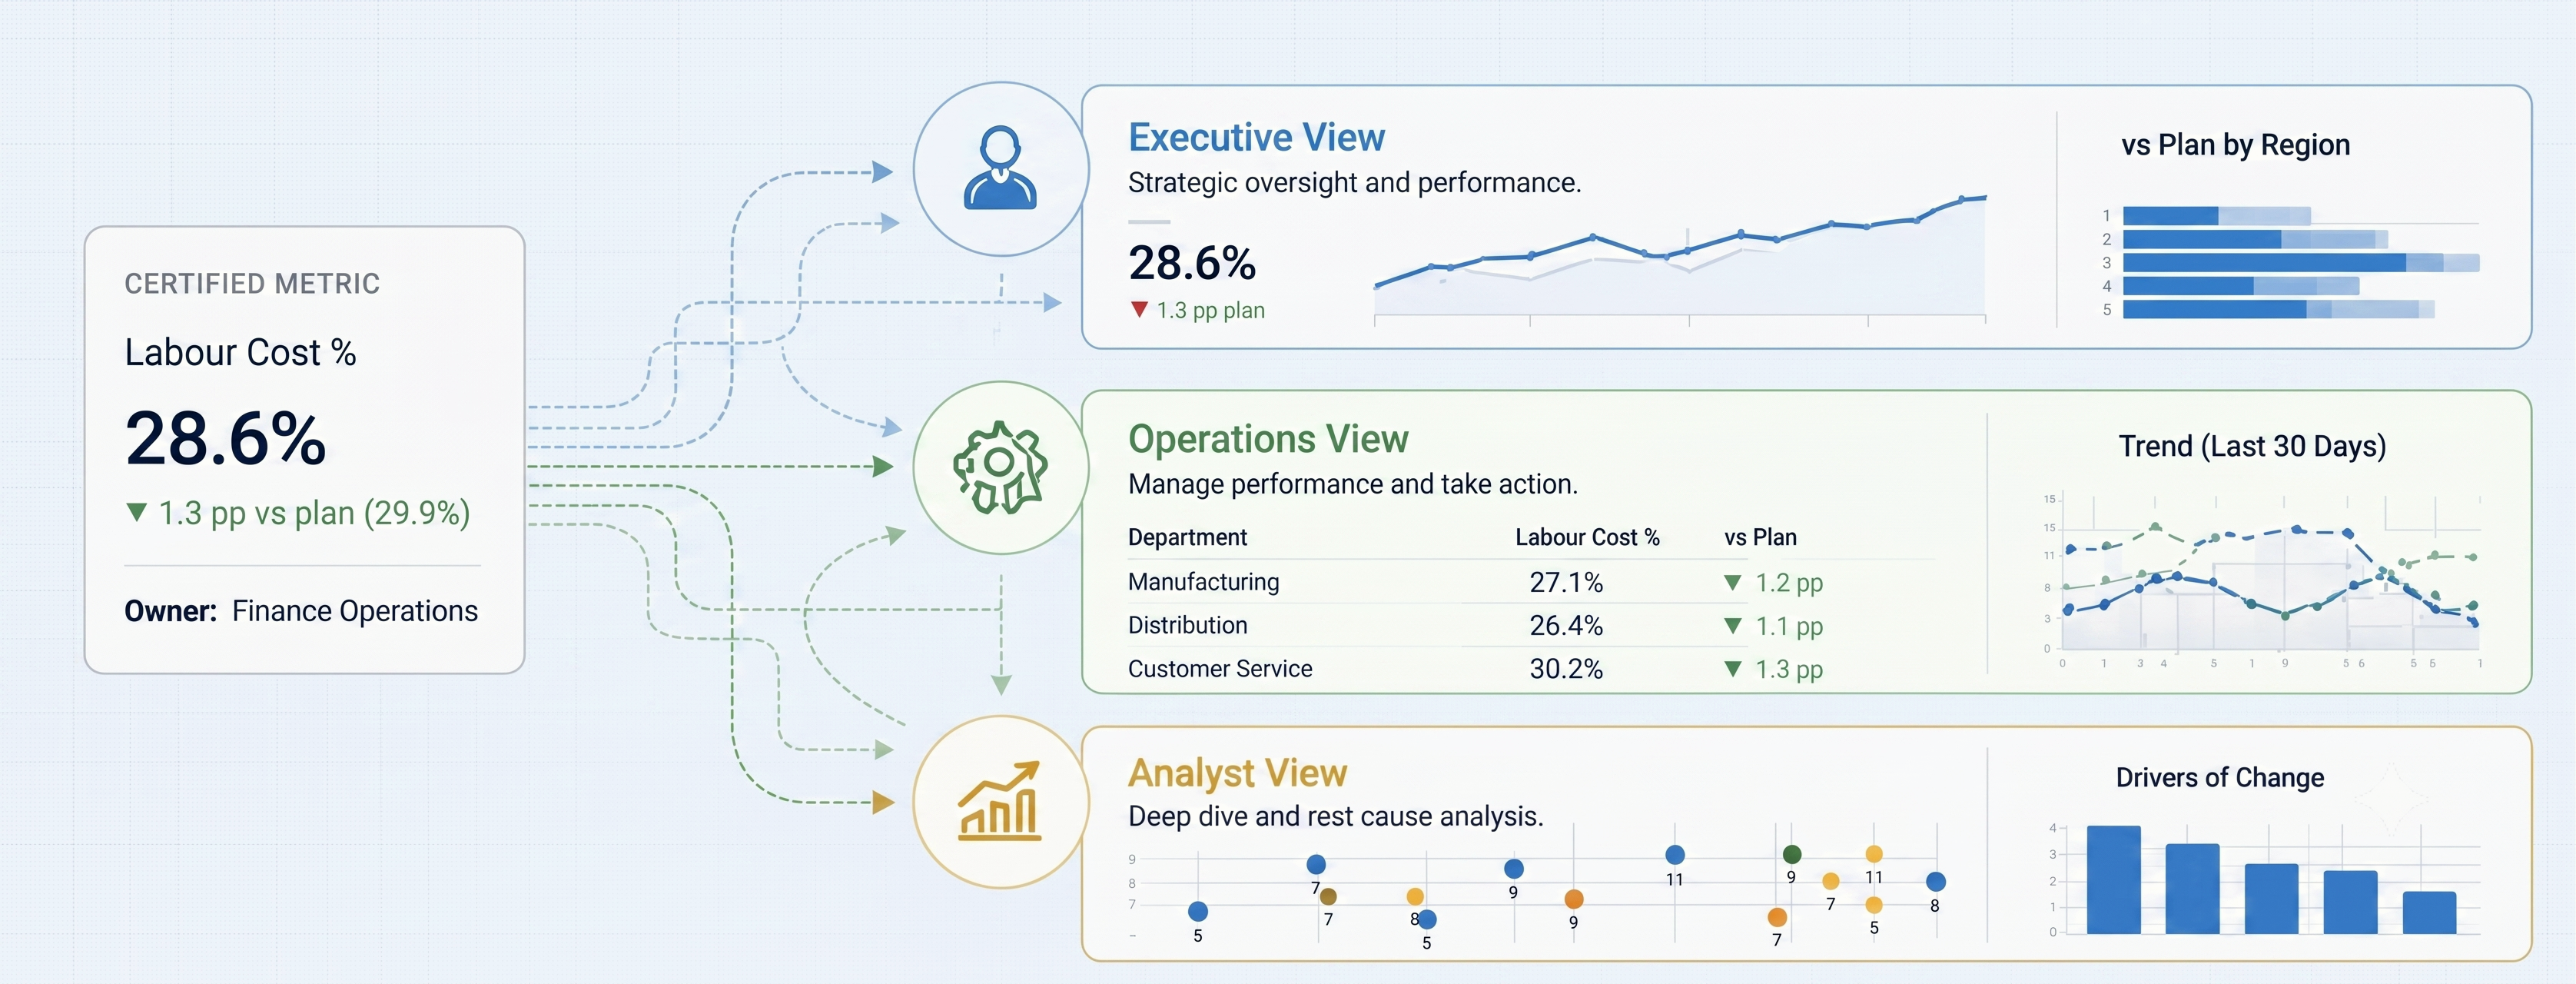
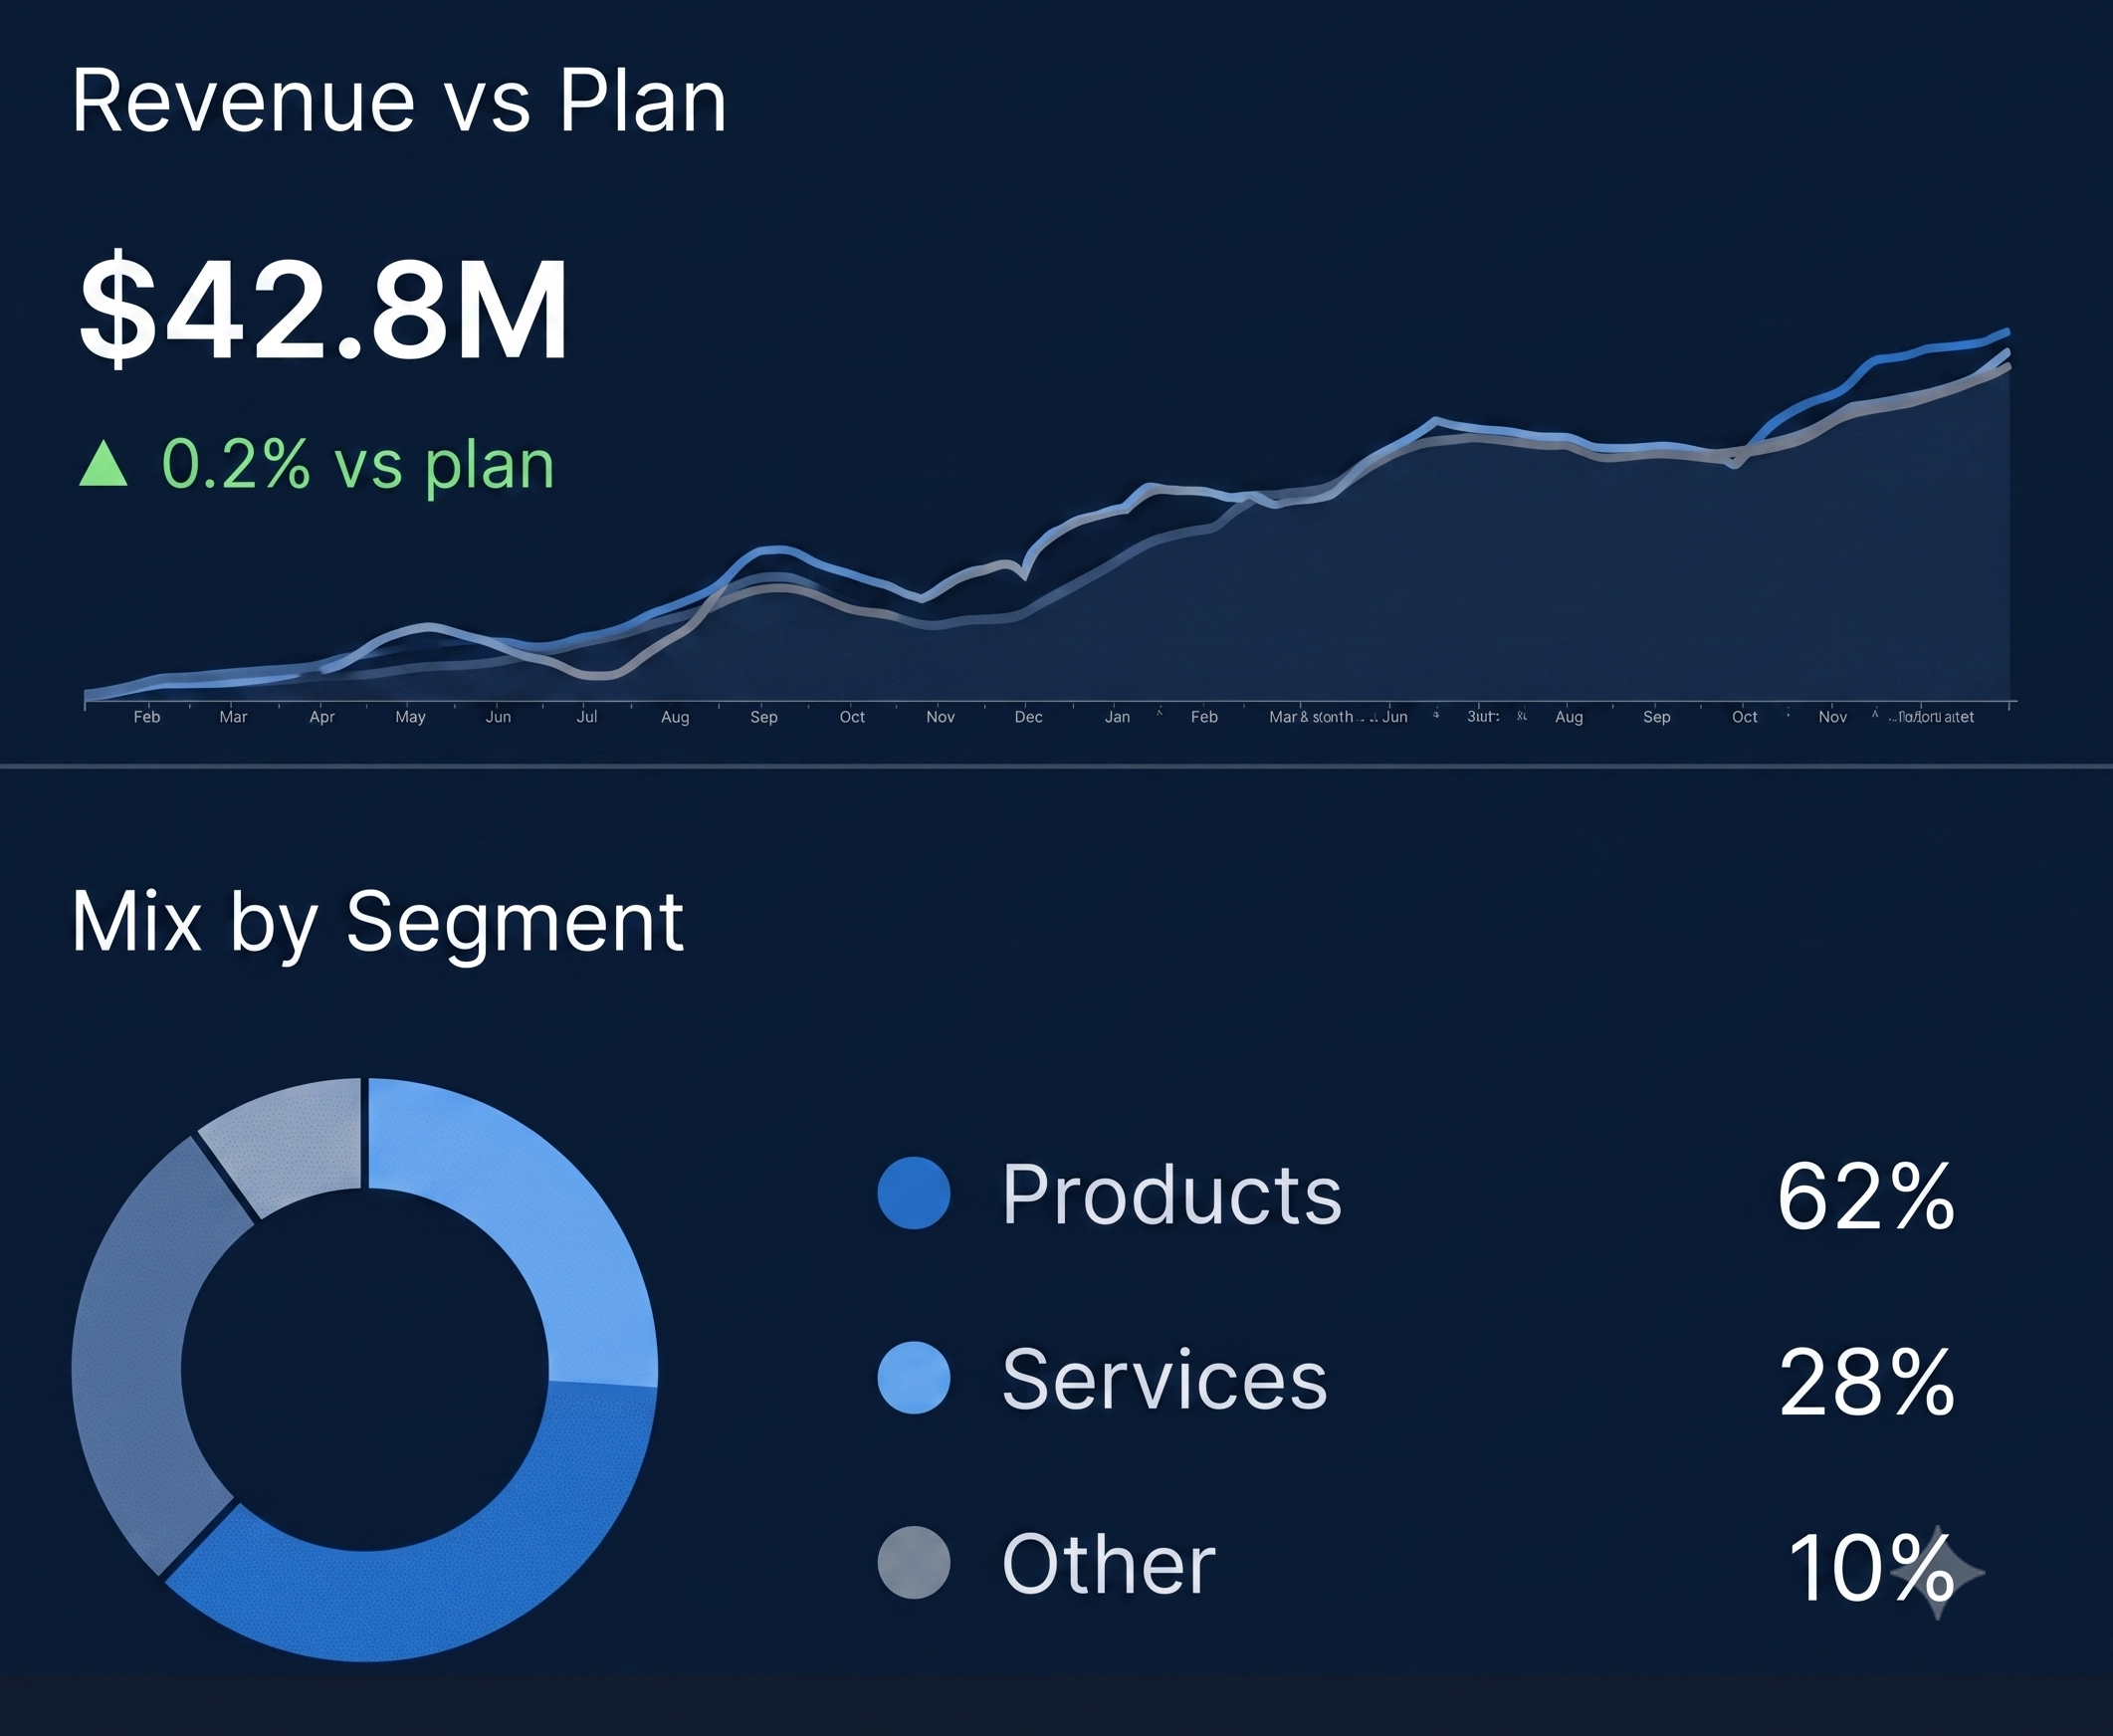
One agreed metric can power many views — each shaped for the audience and the decision it supports.

One certified Labour Cost % metric feeding three role-based views — an executive view for strategic oversight, an operations view with departmental detail, and an analyst view for root-cause analysis.

Ready to make reporting easier to trust?

Let’s build the foundations for confident, data-driven decisions.

Talk to an analytics consultant